
Price Change Bars
Price change bars are a totally different type of bar, as compared with volume, renko, or
time based bars.
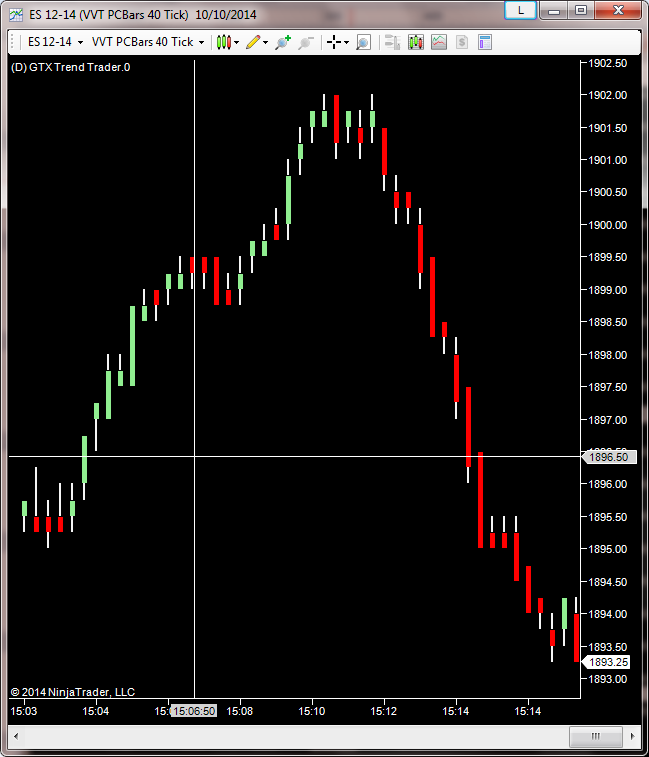
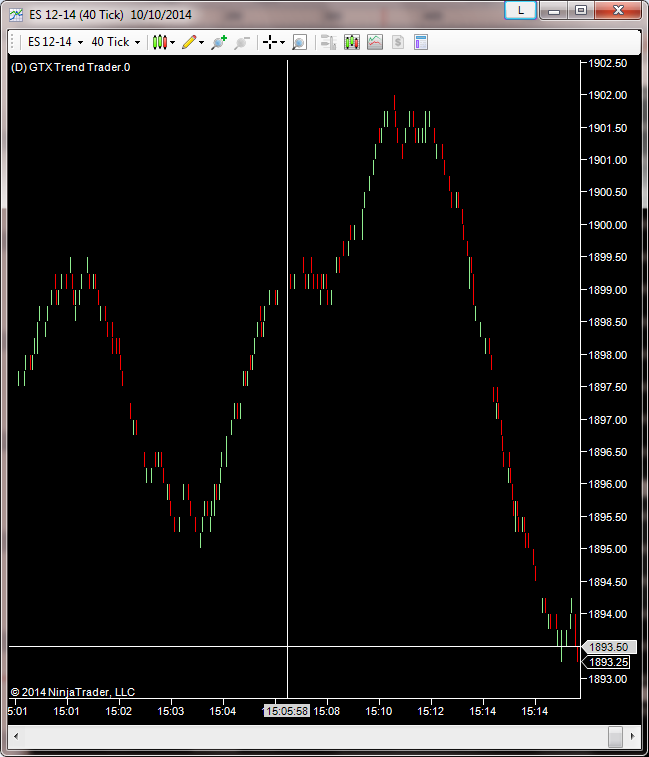
The top chart is a 40 tick price change chart and the one on the bottom is a
normal 40 tick chart. As can be seen, the number of bars for a similar time period is reduced
with this type of bar and indicators will work a little bit differently. A price change chart
needs a certain number of price changes as opposed to a certain number of ticks. When bars are
very short, there is a lot of trading up and down within the bar. When the bars are long, there
isn't a lot of question as to the direction the market is moving, it is moving in the direction of
the bar, either up or down.
VisualVTrader uses this type of bar as opposed to a tick chart which enables us to be able to process
tick charts very efficiently but these can be utilized within NinjaTrader™ as well and indicators can
be applied to this type of chart. It is provided mainly as a convenience to users of VisualVTrader
so a chart in VisualVTrader can be displayed in NinjaTrader™ if desired and other indicators may be
used for confirmation although we do not think that is necessary.
Charts with this bar type may appear slightly differently than the chart in VisualVTrader because it
all depends on which tick started the bar, but the shape will be very similar.